Split Tests & BetScores
05/12/2025
September 3, 2024

DoWhatWorks started 5 years ago to address a fundamental problem in the A/B testing world.
Brands are burning resources running tests that don’t outperform their controls.
Optimizely’s research shows that only 10% of tests are beating the controls.
So we built a technology that can track split tests from any brand on the web, identify what versions win, and then add these insights to a searchable database.
By equipping brands with the data on what wins, they can run tests with a higher win percentage.
How the technology works:

We do not use cookies or pixels, and nothing is placed on the sites we track and monitor. We exclusively use public data.
Once a test is added to the database, customers of DoWhatWorks can access these tests via a personalized dashboard.
How the dashboard works:
Here, a user can track specific companies they want to monitor, look at tests from their industry, track different page types, or search results by what specific elements are being tested.

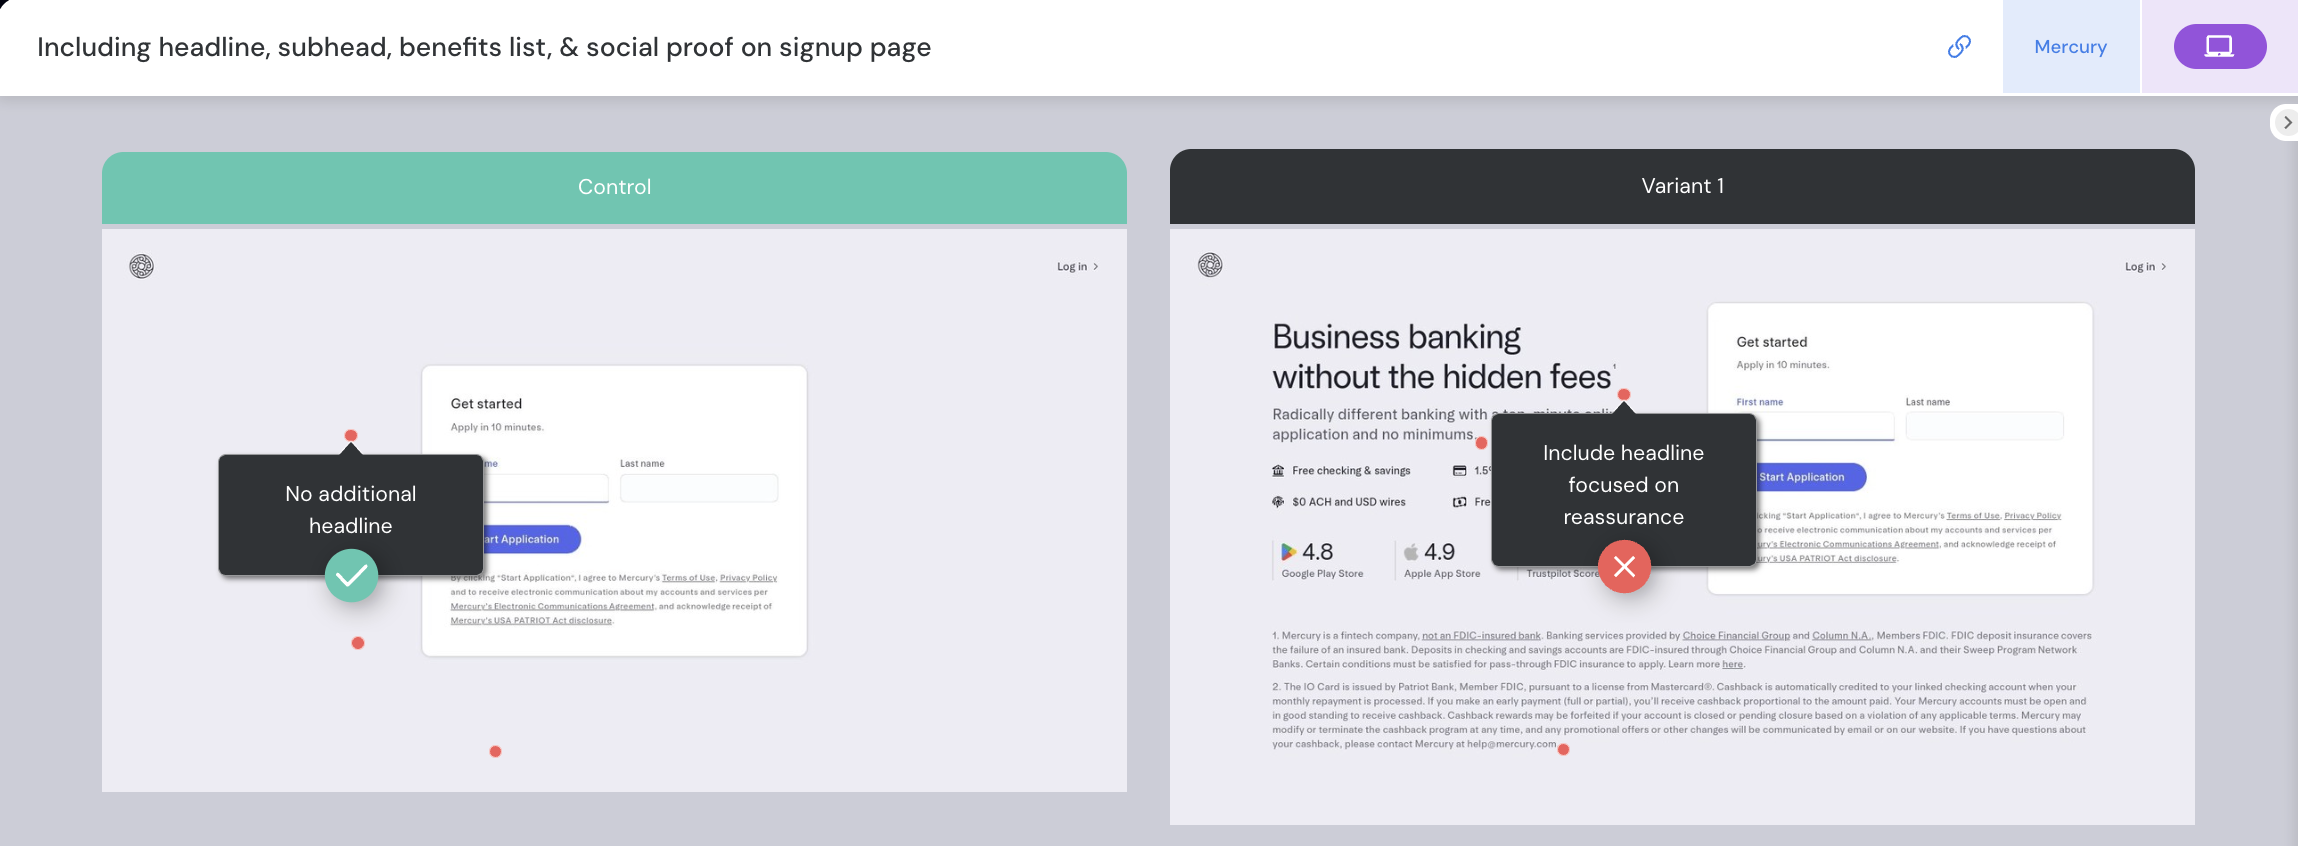
Once you surface a test of interest, you can click into it and get a view of the test like this…

You can see what is being tested on the right-hand side under “What’s Tested”.
If you see multiple numbers (like 1-9), you can click through each of them and see the specific tested element highlighted on the control and variant versions.
The toggle on the “What’s Tested” section is on by default, showing you a green check and copy description of what is used on the winning version, and a red X and copy description on the losing version. If you prefer to see the two versions without this annotation, simply switch the toggle to off.
You can view either a desktop or mobile version of the test, and have a direct link to the current version of the page (live URL).

In addition, you can click the “Watch button” to track a test and return to it later.
If you are looking to explore more tests around a certain theme (let’s say you want to understand how button shape or color impacts different brands), you can search for those variable types directly under the “What’s tested” pulldown on your dashboard.
The dashboard serves as a foundation to understand what is working (or failing) in your space.
However, many brands have specific research questions or ideas that they want to validate.
To answer them effectively, our world-class research team performs meta-analyses on our full library of 27,000+ A/B tests to create BetScoresTM.
BetScores are an algorithmic prediction of how likely a strategy is to win. They are based on our entire library of tests, and incorporate in factors like number of variables tested and industry relevance.
We combine full-scale page diagnostics with BetScores to offer tailored insights and recommendations.
If you want to optimize your page with fast, iterative testing, we offer both Rapid Analyses and hands-on Testing Strategies.
Offering #1: Rapid Analysis
A Rapid Analysis dives directly into BetScore analysis for 1-2 key areas with the speed needed for rapid iteration. In just one month, you gain the insights you need to influence current strategy.
Offering #2: Testing Strategies
We begin with a Blind Spot Analysis, a detailed diagnostic of an existing surface, identifying all potential problem areas and opportunities for optimization. Our research team then works collaboratively with you to build a testing roadmap. Each month, we deliver a test strategy with a research-backed hypothesis and low-fi wireframes. We work together to interpret learnings and iteratively test.
If you want to redesign your page or make big swings, we have two in-depth analysis offerings that give you the data you need to do so with confidence:
Offering #3: Advanced Analysis
We begin with a Blind Spot Analysis and then take those problems identified and address them with specific insights and recommendations. This research yields BetScores (typically 4-6 key areas) and a roadmap of testing recommendations (prioritized based on comprehensive research). This offering includes more expansive research than the previous offerings, but no wireframes.
Offering #4: Interactive Page Blueprint
The Interactive Page Blueprint is ideal for new page development (or a redesign), offering best practices discovered through in-depth research, a low-fi wireframe, and a roadmap of testing recommendations for optimization post-launch. In just two months, you will be set to launch and learn through your new page.